
The S&P 500 and Overbought Conditions
So I've seen and heard plenty recently about the SPX reaching severely overbought conditions. Here I'll introduce RSI and then discuss three simple questions... What does that mean? How important is it? What do we do about it?
What is the Relative Strength Index?
One of basic elements of the technical toolkit is the oscillator. Simply put, you are taking a price series and measuring the "momentum" of the price movements. To put another way,
how
is the price moving from point A to point B? Oscillators will usually have a defined range of values which allows you to attempt to answer the question "How strong is this price movement relative to previous price movements?"
The most commonly used oscillator is the Relative Strength Index (RSI) which was created by Welles Wilder and discussed in his book New Concepts in Technical Trading Systems. The general idea is that you measure the average up day vs. the average down day. That is, when the stock closes higher than yesterday, how much higher does it tend to go? When the stock closes lower than yesterday, how much lower does it tend to go? RSI basically shows you the strength of the up days and down days to measure the underlying strength of a price trend.
One issue with RSI is that it is based on an exponential average, which means that for every new data point you assign a % weight to the new value and a % weight to the previous RSI value. This means that the starting point for your exponential calculation is very important. Unfortunately, there is no "industry standard" on how to begin the calculation, so you will see different RSI values from different chart providers.
What does it mean that the SPX is overbought?
When the RSI is above 70, the indicator is overbought. This suggests that the stock has moved too high too quickly and you may expect a downside correction. I feel this is a great illustration of herding, which is a behavioral pattern where many people pile on to one side of a situation. To simplify, let's say we see a stock rally, we all get really excited, and we all start euphorically buying the stock. We are all herding in to a position. The problem is that eventually there will be no one left to buy as the price will appreciate to the point where it's a less attractive entry point. At this point, with an absence of buyers, the stock will correct as sellers enter and supply enters the market.
When an oscillator like RSI goes above an even higher threshold (for example, 80) then you may consider this a "severely overbought" condition.
So the SPX becoming overbought suggests that this most recent rally has become fairly extended and you may expect a downside correction.
How important is the overbought condition?
This is where the value of technical analysis as a history lesson really shines. I went back to 1994 and looked at when and how the SPX became overbought, and what happened afterwards. Chart below- a daily S&P 500 chart with a 14-day RSI in the bottom panel.
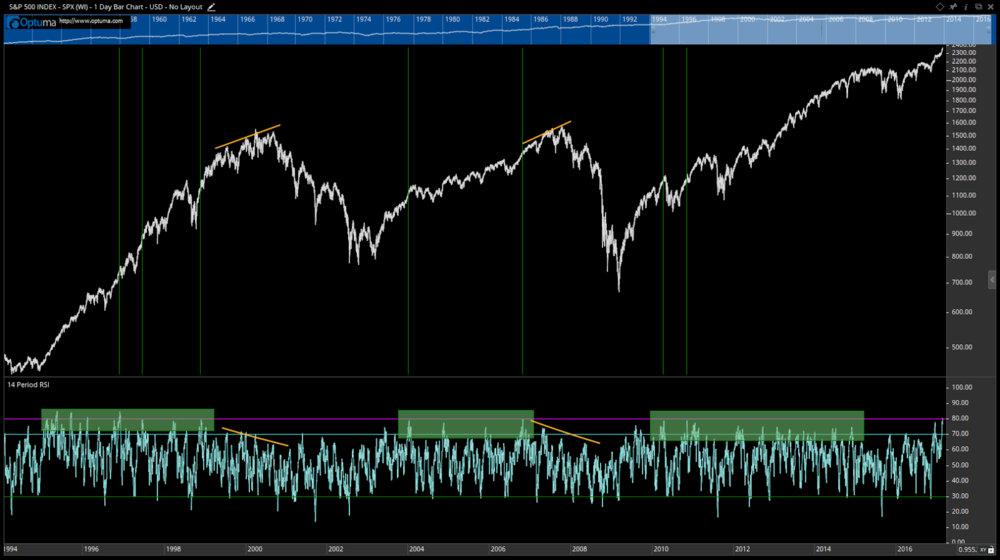
Source: Optuma
I've used vertical green lines to indicate when the RSI was at or near 80. The key to this history lesson is that all of these occurrences happened during cyclical bull markets. I highlighted these clusters of high RSI values with green rectangles. So to be clear, the current situation really only happens when the market is overall in a very strong upward configuration.
Toward the end of cyclical bull markets, you tend to see a divergence between price and RSI. I've indicated these with orange trend lines in 1999-2000 and 2007.
While we certainly saw elevated RSI values from 2010-2015, we never really had the same bearish divergence. And in neither of those previous times did we have a rounding top before a resumption of the uptrend and another round of overbought conditions.
To summarize, the stock market doesn't tend to top out like this. It tops out with a series of lower RSI peaks as we shift from an accumulation phase to a distribution phase.
What do we about all of this?
If you go back through all of the RSI overbought conditions, you'll see the many if not most are accompanied by some corrective pattern. This can be as brief and shallow as the 2.5% drop in December 1996 or more significant like the 17% drop in 2010. Also remember that a market can correct in two ways- price and time. The most recent overbought condition (December 2016) essentially resulted in a month-long consolidation before a resumption of the uptrend.
For now, it is most prudent to monitor price action and support levels in the market and in key stocks. And remember that when the market is overbought, all that means is that it's been going up. A lot. Isn't that a good thing?.....
Disclaimer: This blog is for educational purposes only, and should not be construed as financial advice. Please see the Disclaimer page for full details.