
Profit Is Like Oxygen
The market is gearing up for today’s earnings report from Magnificent 7 standout Nvidia. No other stock perhaps encapsulates the AI-fueled bull market of 2025 as much as NVDA, which has powered off its April low to achieve another new all-time high this month.
While technical analysis does not necessarily help us predict the outcome of earnings releases, it can help us better assess investor psychology leading into their latest report.
Let’s review the evidence for Nvidia…
The stock is back above three upward-sloping moving averages, showing that the trend is undeniably bullish going into this week.
The RSI has been trending lower since mid-July, which means these latest all-time highs have been driven by less buying power than in previous upswings.
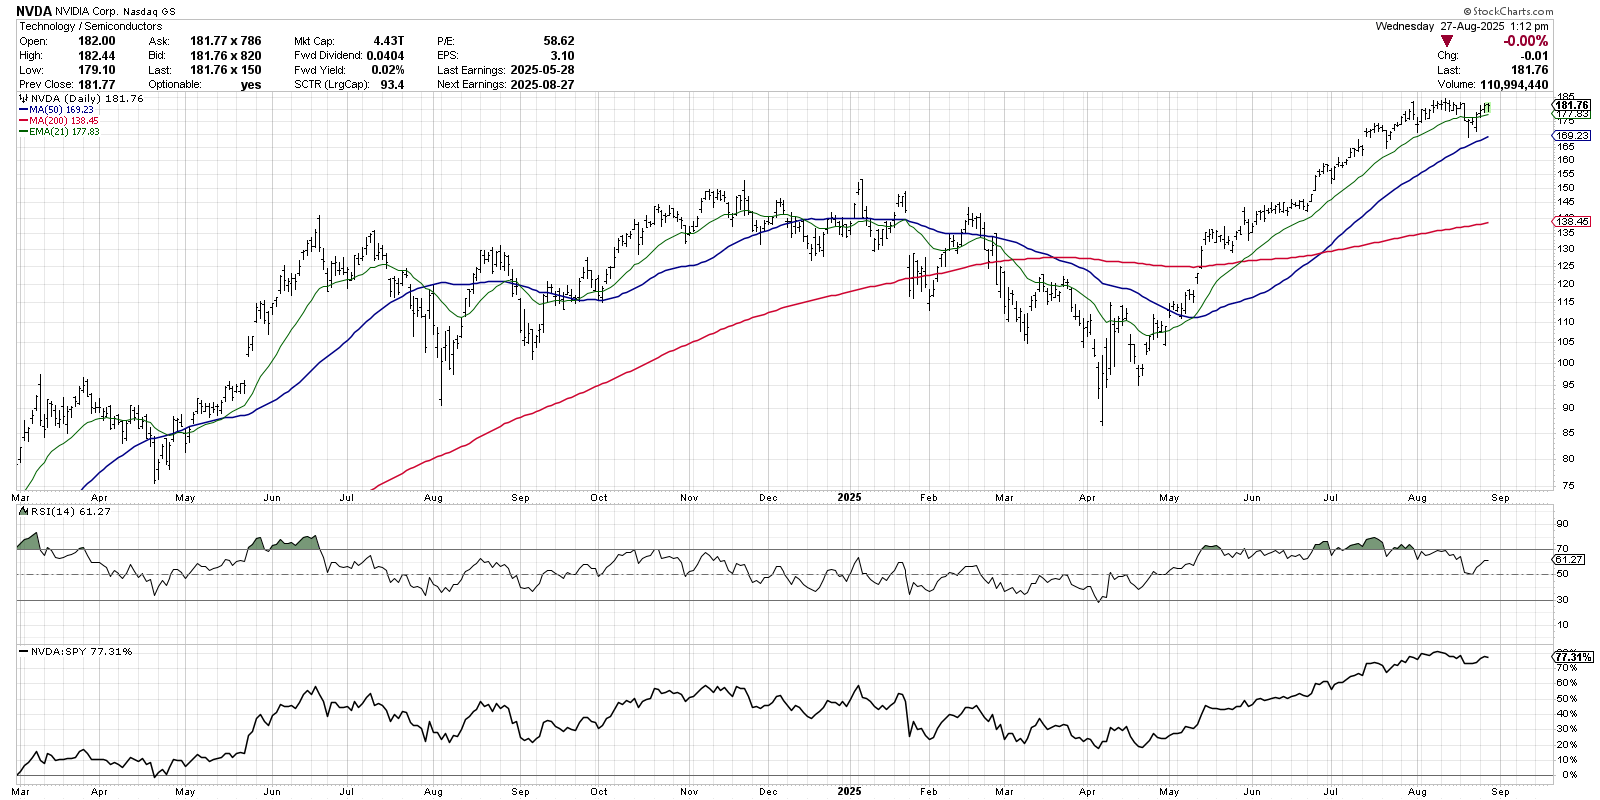
Source: StockCharts.com
The relative strength is trending higher, reminding us that NVDA has been consistently outperforming the S&P 500 since the April 2025 market low.
Technical indicators can be generally grouped into two main buckets- leading indicators and lagging indicators.
Leading indicators like RSI help us recognize shifts in momentum. Even though the price of NVDA is still going up, the momentum behind those gains has begun to dissipate.
Lagging indicators such as moving averages are designed to follow trends, not anticipate changes. So with the moving averages all trending higher, we can detect no real signs of a change in trend at this point.
The stock market is a forward-pricing mechanism, meaning we’re not valuing stocks based on what they’ve earned up until now, but more about expectations for what they’ll be able to earn in the future.
Charts like NVDA are “innocent until proven guilty” in my book, as the consistent uptrend tells me that investors remain optimistic for future growth from this tech superpower.
Will the uptrend in Nvidia end at some point? Without a doubt. And while some leading indicators are showing a slowdown in the upward momentum, the trend remains quite strong.
When in doubt, follow the trend!
RR#6,
Dave
PS- Need help upgrading your investment process using a thoughtful balance of leading and lagging indicators? Our Market Misbehavior premium membership may just be the perfect holiday gift to yourself! Use code MMWEEKLY for 30% off the first 12 months on any plan.
Disclaimer: This blog is for educational purposes only and should not be construed as financial advice. The ideas and strategies should never be used without first assessing your own personal and financial situation, or without consulting a financial professional.
The author does not have a position in mentioned securities at the time of publication. Any opinions expressed herein are solely those of the author and do not in any way represent the views or opinions of any other person or entity.